
Examples / 01
Screening with ten factors: warpage in injection moulding
An injection-moulded part warps, and ten machine settings are candidates for the cause. Every combination would be 1,024 runs. This example shows how 26 runs are enough to find the four settings that matter — along with the one interaction a one-factor-at-a-time trial would never have seen.
- Design
- Min-run, resolution IV, with centre runs
- Runs
- 22 + 4 = 26
- Factors
- 10, all continuous
- Response
- Warpage in mm, to be minimised
The measurements are simulated. They come from a model we set ourselves, plus random scatter — which makes it possible to check at the end whether the analysis finds what is really in there. The model is given in the section “Cross-check”. Every table and chart was computed and drawn by DoEStat.
Step 1 / The question
Ten settings, one question: which of them matter?
The part is a flat housing made of a semi-crystalline polymer. Warpage is measured as the largest deviation from the plane in millimetres; the smaller, the better. The process engineers name ten quantities they can change on the machine and consider suspect. For each they set a low and a high value between which the machine runs safely.
| Factor | Unit | low (−1) | centre (0) | high (+1) |
|---|---|---|---|---|
| A · Melt temperature | °C | 220 | 240 | 260 |
| B · Mould temperature | °C | 40 | 55 | 70 |
| C · Injection speed | mm/s | 40 | 70 | 100 |
| D · Holding pressure | bar | 300 | 400 | 500 |
| E · Holding time | s | 4 | 7 | 10 |
| F · Cooling time | s | 10 | 15 | 20 |
| G · Back pressure | bar | 40 | 70 | 100 |
| H · Screw speed | 1/min | 60 | 90 | 120 |
| J · Switch-over point | mm | 8 | 11 | 14 |
| K · Drying time | h | 2 | 3 | 4 |
A screening does not yet answer the question of the best setting. It separates the few active factors from the many that can be left alone afterwards — and it should do so in few enough runs to leave budget for the optimisation proper.
Step 2 / Choosing the design
Four candidates, one criterion: keep the main effects clean
For ten factors DoEStat offers several screening designs. The table puts four of them side by side, each with four centre runs. Two figures decide: the power, that is the probability of detecting an effect of two standard deviations, and the largest correlation between a main effect and a two-factor interaction. If that correlation is not zero, an interaction can mimic or mask a main effect.
| Design | Runs | Kind | Error degrees of freedom | Power for an effect of 2 σ | Largest correlation main effect ↔ interaction |
|---|---|---|---|---|---|
| Plackett–Burman | 16 | resolution III | 5 | 78.9 | 0.33 |
| Definitive screening design | 24 | three levels | 13 | 97.5 | 0.00 |
| Min-run, resolution IV | 26 | resolution IV | 15 | 98.2 | 0.00 |
| Fractional factorial 2^(10−5) | 36 | resolution IV | 25 | 100.0 | 0.00 |
The Plackett–Burman design is the most economical, but its main effects are entangled with interactions (correlation 0.33), and with five degrees of freedom for error its power stays below 80%. The regular 210−5 fraction is statistically the strongest but costs ten more runs. In between are two designs that keep main effects clear of interactions: the definitive screening design and the minimum-run resolution IV design. The min-run design is chosen: two levels per factor suit the question, and 15 degrees of freedom for error leave room to add interactions to the model later.
The price of 22 instead of 32 runs: the main effects are no longer exactly uncorrelated among themselves (largest correlation 0.27, variance inflation at most 1.16). That costs a little precision but distorts nothing, because the analysis estimates all ten jointly.
Decision: minimum-run resolution IV design with 22 runs, plus four centre runs — 26 instead of 1,024.
Step 3 / Design and data
The design in the order it is run
The order is random; only the four centre runs (all factors at mid setting, highlighted in the table) are spread evenly over the series. That way they also show whether the process drifts during the experiment. A plus stands for the high, a minus for the low level of the factor; the letters are those of the table above.
| Run | A | B | C | D | E | F | G | H | J | K | Warpage [mm] |
|---|---|---|---|---|---|---|---|---|---|---|---|
| 1 | + | + | + | + | + | − | + | − | − | + | 1.59 |
| 2 | − | + | − | + | + | − | − | + | − | − | 1.36 |
| 3 | + | − | + | + | + | − | − | + | + | + | 0.94 |
| 4 | − | − | − | − | − | + | − | + | + | − | 1.13 |
| 5 | + | + | + | − | − | − | − | + | − | − | 2.00 |
| 6 | 0 | 0 | 0 | 0 | 0 | 0 | 0 | 0 | 0 | 0 | 1.27 |
| 7 | − | − | − | − | + | − | + | + | − | + | 1.47 |
| 8 | − | + | + | − | + | + | − | + | − | + | 1.53 |
| 9 | + | − | − | + | − | − | + | − | + | − | 0.87 |
| 10 | − | − | + | − | + | − | + | − | + | − | 1.58 |
| 11 | + | − | + | − | − | + | + | − | + | + | 1.41 |
| 12 | + | + | − | + | − | + | − | + | − | + | 1.24 |
| 13 | 0 | 0 | 0 | 0 | 0 | 0 | 0 | 0 | 0 | 0 | 1.22 |
| 14 | − | − | + | + | − | − | − | − | − | + | 0.76 |
| 15 | − | − | − | + | + | + | + | − | + | + | 0.48 |
| 16 | + | − | − | − | + | + | − | − | − | − | 1.43 |
| 17 | − | + | + | + | + | + | − | − | + | − | 1.06 |
| 18 | + | − | + | + | + | + | + | + | − | − | 0.64 |
| 19 | 0 | 0 | 0 | 0 | 0 | 0 | 0 | 0 | 0 | 0 | 1.19 |
| 20 | + | + | − | − | + | + | + | + | + | − | 1.68 |
| 21 | + | + | + | + | − | + | − | − | + | − | 1.26 |
| 22 | − | + | − | − | − | − | − | − | + | + | 1.72 |
| 23 | − | + | + | + | − | − | + | + | + | + | 1.31 |
| 24 | + | − | − | − | − | − | + | + | − | + | 1.73 |
| 25 | − | + | − | − | − | + | + | − | − | − | 1.44 |
| 26 | 0 | 0 | 0 | 0 | 0 | 0 | 0 | 0 | 0 | 0 | 1.18 |
The four centre runs lie between 1.18 and 1.27 mm. That span is the scatter of the process at an unchanged setting — the yardstick for every effect. Across the whole design the warpage ranges from 0.48 to 2.00 mm: there is something to find.
Step 4 / Main effects
Four factors stand out, six do not
First the simplest model: ten main effects. The effect of a factor is the average change in warpage when it is moved from its low to its high level.
| Factor | Effect (low → high) | Std. error | t | p |
|---|---|---|---|---|
| D · Holding pressure | −0.610 | 0.054 | −11.22 | < 0.0001 |
| B · Mould temperature | 0.443 | 0.054 | 8.15 | < 0.0001 |
| F · Cooling time | −0.298 | 0.054 | −5.47 | < 0.0001 |
| A · Melt temperature | 0.211 | 0.054 | 3.90 | 0.0014 |
| E · Holding time | 0.039 | 0.054 | 0.72 | 0.4798 |
| C · Injection speed | 0.032 | 0.054 | 0.60 | 0.5591 |
| J · Switch-over point | −0.021 | 0.054 | −0.38 | 0.7098 |
| H · Screw speed | −0.019 | 0.054 | −0.36 | 0.7266 |
| K · Drying time | 0.010 | 0.054 | 0.18 | 0.8566 |
| G · Back pressure | −0.003 | 0.054 | −0.06 | 0.9549 |
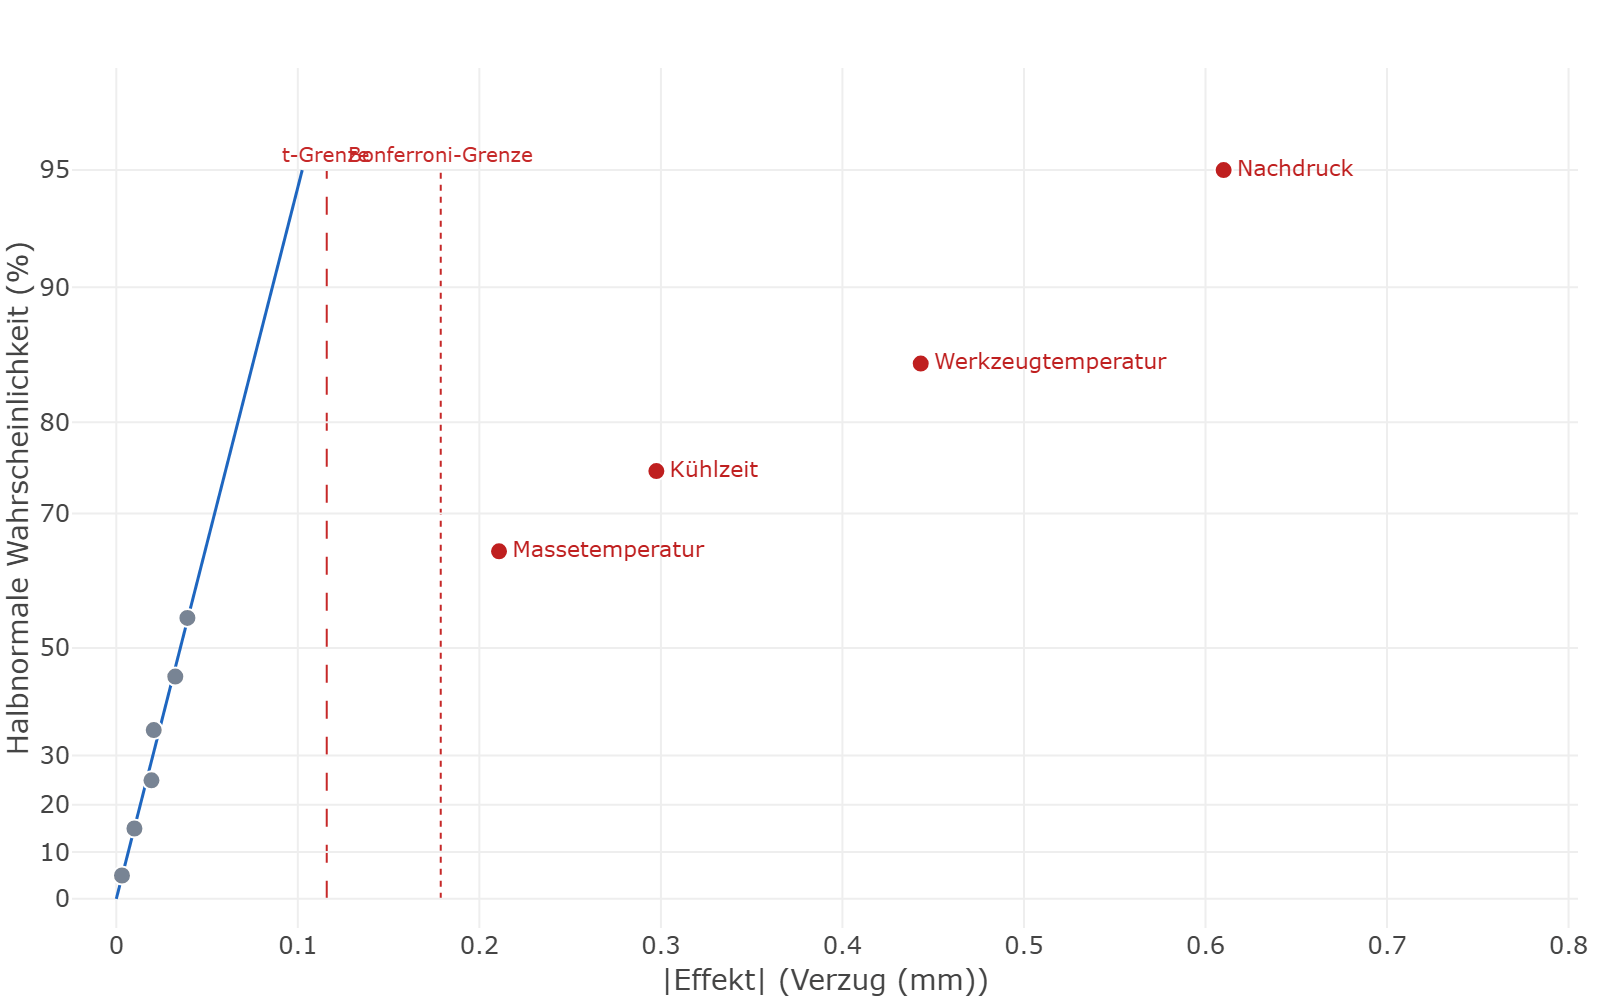
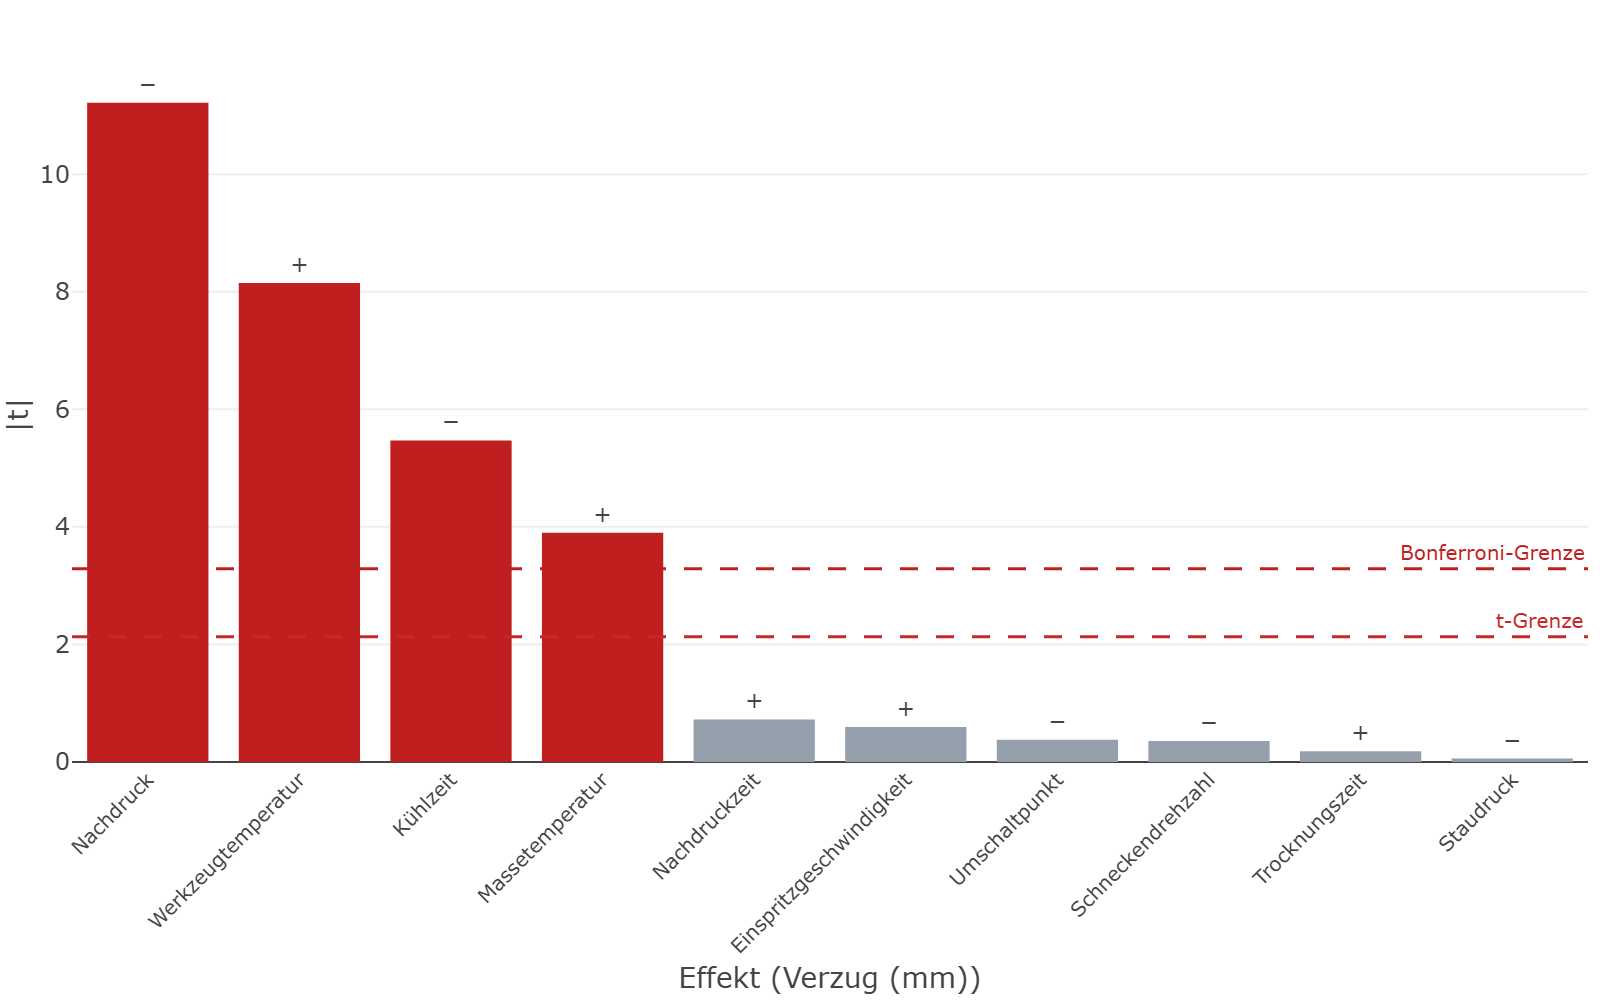
The picture is clear: holding pressure (−0.61 mm), mould temperature (+0.44 mm), cooling time (−0.30 mm) and melt temperature (+0.21 mm) are active, all with p < 0.002. The other six effects are smaller than 0.04 mm and cannot be told from chance (p ≥ 0.48).
That does not finish the analysis. The residual standard deviation of this model is 0.118 mm — almost three times what the centre runs show as process scatter — and the lack-of-fit test responds (p = 0.039). The model is missing something.
Step 5 / Interaction
What the model lacks is an interaction
In a resolution IV design the main effects are clear of two-factor interactions, but the 45 interactions cannot all be separated from one another. So one does not test all of them, only the plausible ones: interactions between factors that are active themselves. With four active factors that is six candidates. DoEStat adds them to the ten main effects and removes backwards, step by step, whatever is not significant (p-value, α = 0.05); a main effect stays in the model as long as an interaction needs it.
What remains are the four main effects and exactly one interaction: mould temperature × holding pressure.
| Source | Sum of squares | df | Mean square | F | p |
|---|---|---|---|---|---|
| Model | 3.071 | 5 | 0.6142 | 214.25 | < 0.0001 |
| Melt temperature | 0.2301 | 1 | 0.2301 | 80.27 | < 0.0001 |
| Mould temperature | 1.037 | 1 | 1.037 | 361.90 | < 0.0001 |
| Holding pressure | 1.895 | 1 | 1.895 | 660.97 | < 0.0001 |
| Cooling time | 0.4727 | 1 | 0.4727 | 164.90 | < 0.0001 |
| Mould temperature × Holding pressure | 0.1712 | 1 | 0.1712 | 59.72 | < 0.0001 |
| Residual | 0.05733 | 20 | 0.002867 | ||
| Lack of fit | 0.05243 | 17 | 0.003084 | 1.89 | 0.3320 |
| Pure error | 0.004900 | 3 | 0.001633 | ||
| Total | 3.128 | 25 |
| Term | Coefficient (coded) | Std. error | t | p | 95% CI lower | 95% CI upper |
|---|---|---|---|---|---|---|
| Intercept | 1.281 | 0.01054 | 121.60 | < 0.0001 | 1.259 | 1.303 |
| Melt temperature | 0.1039 | 0.01159 | 8.96 | < 0.0001 | 0.07967 | 0.1280 |
| Mould temperature | 0.2205 | 0.01159 | 19.02 | < 0.0001 | 0.1963 | 0.2447 |
| Holding pressure | −0.2980 | 0.01159 | −25.71 | < 0.0001 | −0.3222 | −0.2738 |
| Cooling time | −0.1489 | 0.01159 | −12.84 | < 0.0001 | −0.1730 | −0.1247 |
| Mould temperature × Holding pressure | 0.08852 | 0.01146 | 7.73 | < 0.0001 | 0.06463 | 0.1124 |
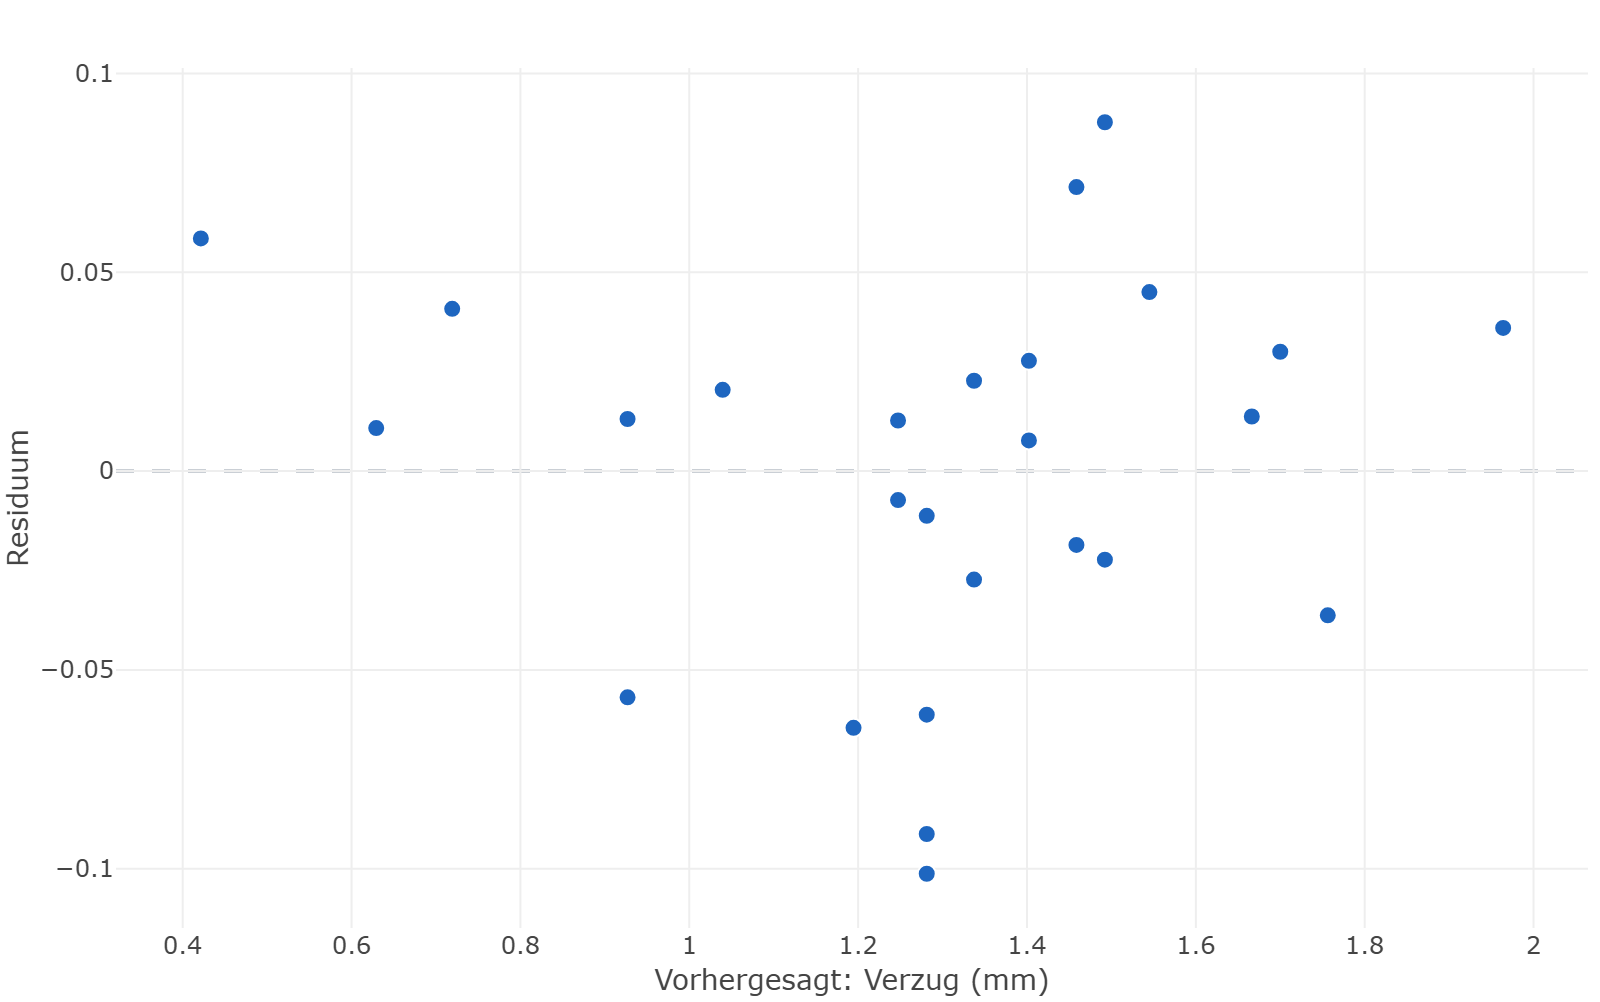
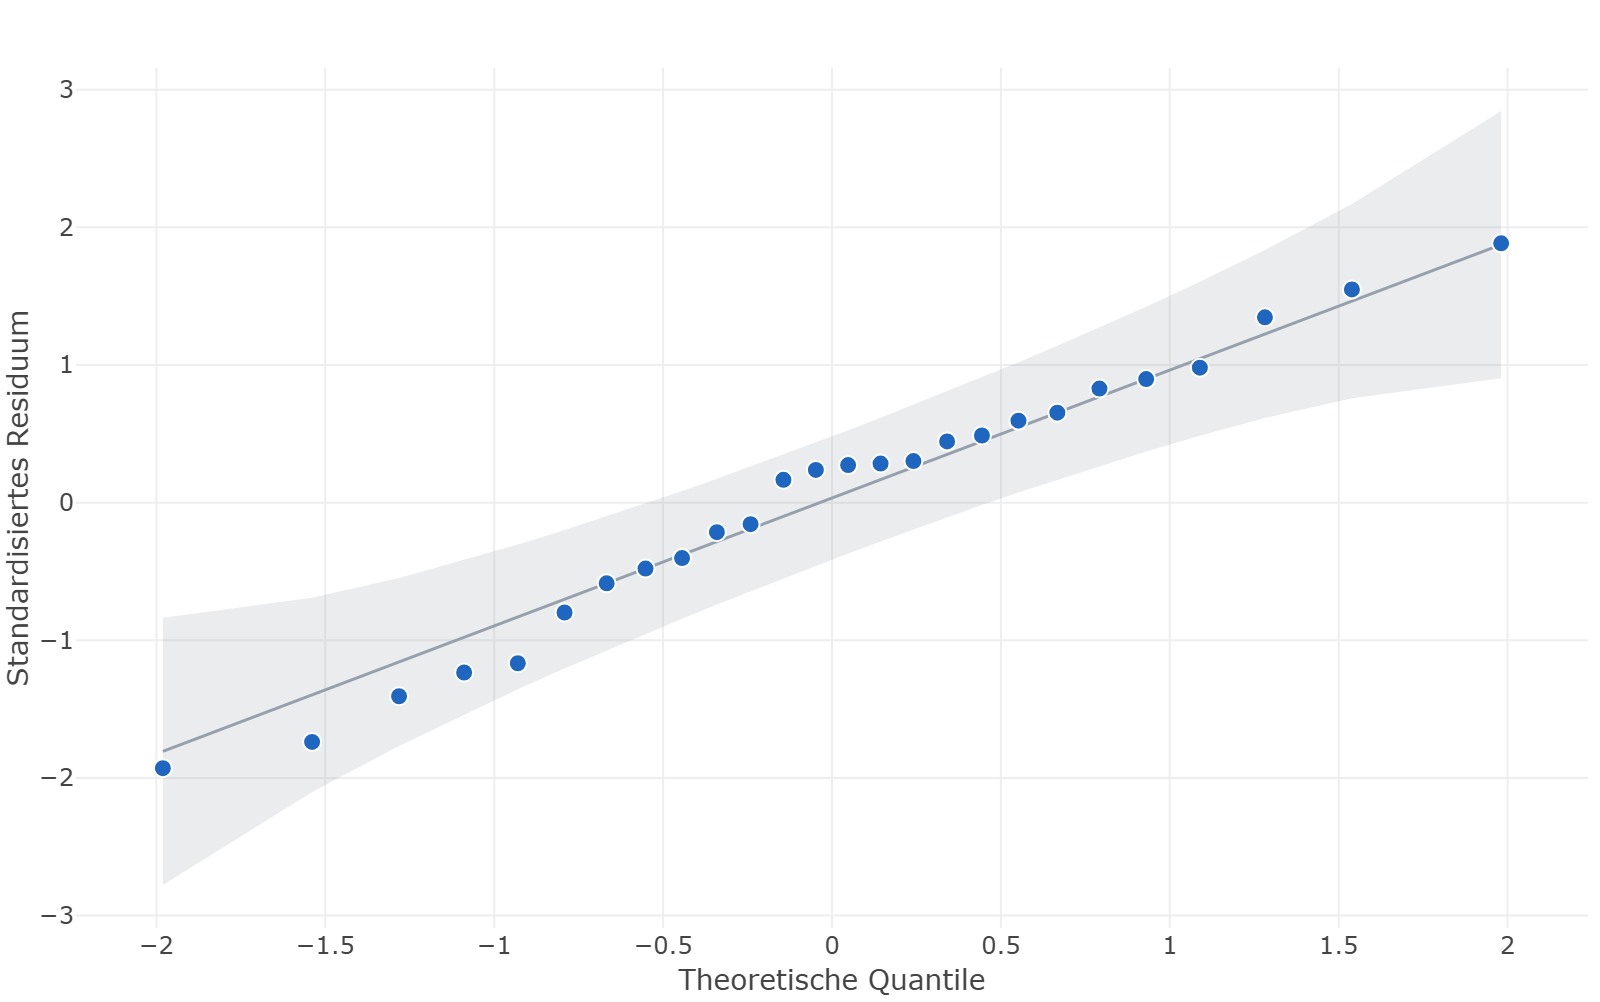
The residual standard deviation falls from 0.118 to 0.054 mm, R² rises to 0.982 (adjusted 0.977, predicted 0.971), and the lack of fit is no longer significant (p = 0.33). The coefficients are in coded units: they apply per step from the centre to the high level; the effect from low to high is twice that.
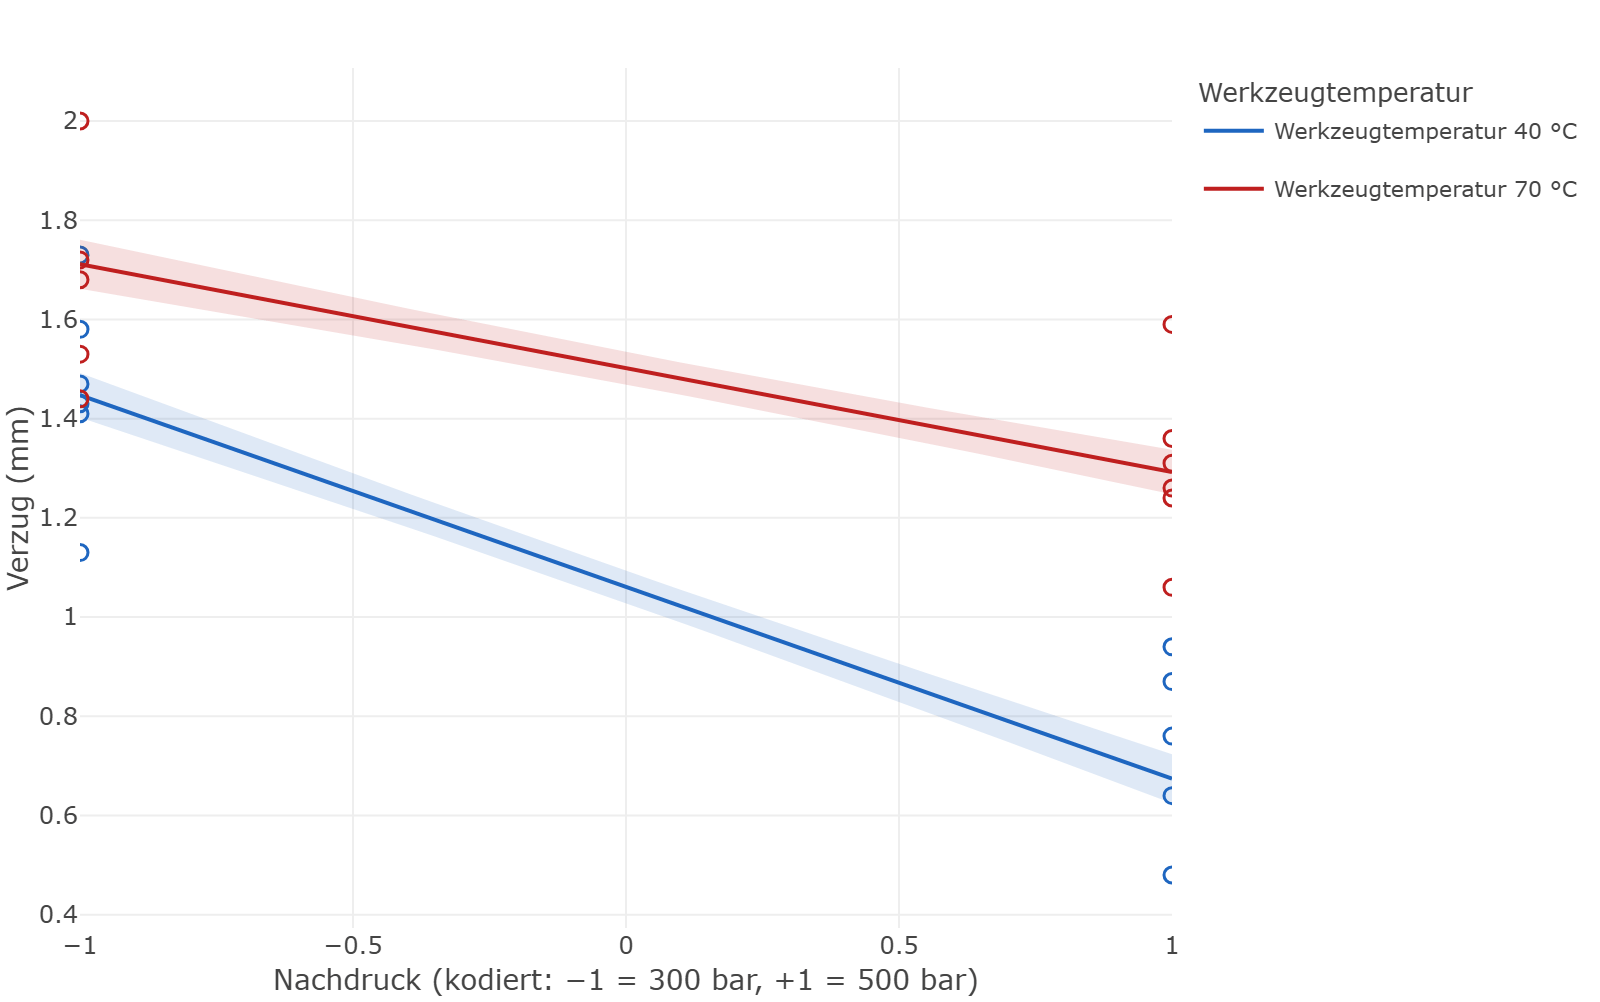
In figures: from 300 to 500 bar the warpage falls by 0.77 mm at a mould temperature of 40 °C, and by only 0.42 mm at 70 °C. Anyone who had tried the holding pressure with a warm mould and found it moderately effective would have underrated their best lever.
Step 6 / Curvature
The centre runs say: the surface is not flat
A two-level design can only fit straight lines. Whether that is enough is what the centre runs check: if the model holds, they should lie on its prediction for the centre. The model predicts 1.281 mm there (95% confidence interval 1.259 to 1.303); the measured mean is 1.215 mm. The centre is better than the average of the corners — the surface sags.
In DoEStat this is tested by adding a quadratic term to the model. It is significant: 0.078 ± 0.024 mm, p = 0.004. What matters is what this test does not say: in a two-level design with centre runs the squares of all factors are one and the same column. The design knows that something is curved, but not which factor.
Conclusion: for the corners of the region the model is sound. Looking for the optimum in the interior takes a follow-up design with more than two levels — for four factors instead of ten. How that works is shown in example 2 and example 4.
Step 7 / Result
The setting, and three runs that confirm it
The smallest warpage is in the corner all four effects point to: holding pressure high, cooling time long, mould and melt cold. The six inactive factors are free — they can be set by cost, cycle time or wear.
| Factor | Setting | Reason |
|---|---|---|
| A · Melt temperature | 220 °C | active – the low level lowers warpage |
| B · Mould temperature | 40 °C | active – the low level lowers warpage |
| C · Injection speed | 70 mm/s | no detectable effect – free to choose, centre here |
| D · Holding pressure | 500 bar | active – the high level lowers warpage |
| E · Holding time | 7 s | no detectable effect – free to choose, centre here |
| F · Cooling time | 20 s | active – the high level lowers warpage |
| G · Back pressure | 70 bar | no detectable effect – free to choose, centre here |
| H · Screw speed | 90 1/min | no detectable effect – free to choose, centre here |
| J · Switch-over point | 11 mm | no detectable effect – free to choose, centre here |
| K · Drying time | 3 h | no detectable effect – free to choose, centre here |
For this setting the model predicts 0.42 mm; a single part should lie between 0.29 and 0.55 mm with 95% confidence. In the opposite corner it would be 1.96 mm. Three confirmation runs at the recommended setting:
| Prediction | 95% prediction interval | Confirmation 1 | Confirmation 2 | Confirmation 3 | Joint test p |
|---|---|---|---|---|---|
| 0.421 | 0.292 … 0.551 | 0.38 | 0.43 | 0.45 | 0.8772 |
Result: all three confirmation runs lie within the prediction interval. Four of ten factors carry the warpage, which can be brought down from just under 2 mm to a little over 0.4 mm within the region studied.
Cross-check
What is really in the data
Because the measurements are simulated, the analysis can be measured against the truth. The model behind the data, in coded units and with a standard deviation of 0.035 mm:
Warpage = 1.20 + 0.11·A + 0.21·B − 0.30·D − 0.15·F + 0.10·B·D + 0.09·D² + 0.02·E − 0.015·H
| Term | True | Estimated | 95% CI |
|---|---|---|---|
| Intercept | 1.290 | 1.281 | 1.259 … 1.303 |
| Melt temperature | 0.110 | 0.104 | 0.080 … 0.128 |
| Mould temperature | 0.210 | 0.221 | 0.196 … 0.245 |
| Holding pressure | −0.300 | −0.298 | −0.322 … −0.274 |
| Cooling time | −0.150 | −0.149 | −0.173 … −0.125 |
| Mould temperature × Holding pressure | 0.100 | 0.089 | 0.065 … 0.112 |
All five estimated coefficients hit their true value within the confidence interval. The constant is listed as 1.29 because D² equals 1 at the corners and the two-level design cannot separate the two. The test found the curvature (estimated 0.078, true 0.09) — that it comes from the holding pressure it could not know. Two effects the analysis did not find: holding time (0.02) and screw speed (−0.015) do act, but more weakly than the process scatter. That is not a flaw of the design; it is the limit of what 26 runs resolve.
Project files
Run it yourself
The example ships with DoEStat: Help ▸ Open sample project ▸ Screening ▸ “Ten-factor screening: warpage in injection moulding”, once with the data only and once with the finished analysis. The same files can be downloaded here.
- Project with the dataspritzguss-screening-daten.doejson
- Project with the finished analysisspritzguss-screening-auswertung.doejson
Try DoEStat for free
30 days, the full feature set, no payment details. We send the download link by e-mail, usually on the next business day.